Elementary School Teacher Salary in Richmond, CA: $102,130 (2026)
Quick Answer:A full-time elementary school teacher in Richmond, CA earns a median $102,130/year (≈ $49.10/hour) in nominal terms for 2026 — projected from BLS OEWS 2025 (SOC 25-2021). Once you factor in Richmond's price level (13% above national, BEA RPP 113.1), that paycheck buys what $90,301 would nationally. Nominal pay sits 1.9% above the California state average.
Based on BLS state-level estimates · View source
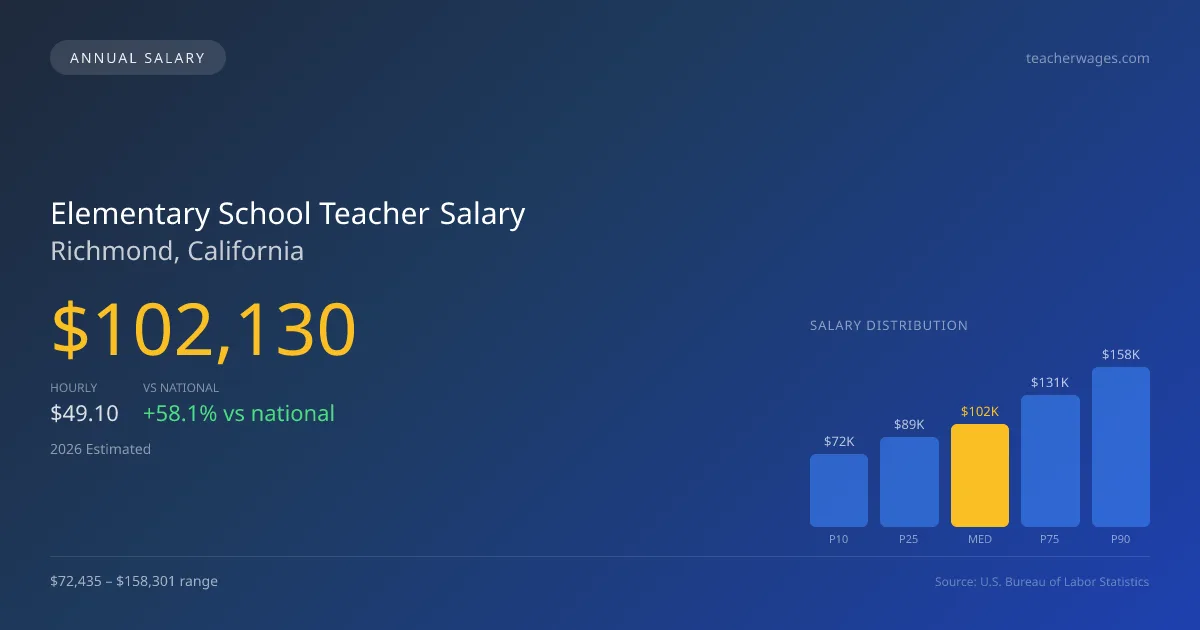
In 2026, elementary school teachers in Richmond, CA, can anticipate a median salary of $102,130, which significantly surpasses the national median of $64,597. Salary figures in this area reflect a range from $72,435 at the lower end (10th percentile) to $158,301 for those at the upper end (90th percentile). These estimates, derived from 2025 BLS data and adjusted for local cost-of-living factors, highlight the competitive compensation available for educators in Richmond. Notably, teachers with advanced degrees, like a master's or beyond, typically occupy more lucrative positions within the district’s step-and-lane salary scale, making this market more attractive for individuals seeking to enter the teaching profession.
About the Richmond Market
Salary estimated from California average ($92,000) adjusted for local cost of living.
Salary Breakdown
| Percentile | Annual | Hourly |
|---|---|---|
| Entry Level (P10) | $72,435 | $34.83 |
| Lower Range (P25) | $88,787 | $42.68 |
| Median (P50)(typical) | $102,130 | $49.10 |
| Upper Range (P75) | $130,603 | $62.79 |
| Top Earners (P90) | $158,301 | $76.11 |
Median Salary Position
58.10% above the national average
2026 Salary Percentile Distribution in Richmond
In Richmond, CA, the elementary school teacher salary spread from the 10th to 90th percentile is $85,866 (2026 est.). At $102,130, the local median is 58.1% above the national median of $64,597.
Salary Calculator
At 40 hours/week in Richmond: You'd be in the lower-middle range
How Richmond Elementary School Teacher Pay Compares
Richmond median: $102,130/year (2026)
| Compared To | Median Salary | Richmond Pays |
|---|---|---|
| California Average | $100,226 | +1.90% more |
| National Average | $64,597 | +58.10% more |
Elementary School Teachers in Richmond, CA earn a median of $102,130 per year (2026 est.), which is 58.10% higher than the national median of $64,597 and 1.90% above the California state average of $100,226.
Cost-of-Living Adjusted Salary
Richmond has a cost of living 13.10% above the national average.
Adjusted salary = nominal × (100 / CoL index). CoL index: 100 = national average.
Richmond, CA has a cost-of-living index of 113.1 (above the national average of 100). While the nominal salary of $102,130 is competitive, the higher cost of living reduces purchasing power to an effective $90,301 — a 11.58% reduction.
Compare Purchasing Power
Select a city to see how your salary compares after cost of living
Select a city above to compare purchasing power
2019 BLS Actual
$94,341
2025 BLS Actual
$101,139
2026 Current Est.
$102,130
2019–2027 Growth
+9.3%
Salary Trajectory for Elementary School Teachers in Richmond (2019–2027)
2019–2025: actual BLS OEWS data for this metro area. 2026+: CAGR 0.98% projection.
| Year | Annual Salary | Status |
|---|---|---|
| 2019 | $94,341 | Actual |
| 2020 | $96,348 | Actual |
| 2021 | $97,076 | Actual |
| 2022 | $97,534 | Actual |
| 2023 | $100,680 | Actual |
| 2024 | $106,022 | Actual |
| 2025 | $101,139 | Actual |
| 2026(current) | $102,130 | Estimated |
| 2027 | $103,131 | Projected |
Based on 7 years of BLS OEWS data for the Richmond metropolitan area, the median elementary school teacher salary grew 7.2% from $94,341 (2019) to $101,139 (2025). At a 0.98% compound annual growth rate, salaries are projected to reach $103,131 by 2027 — a total increase of $8,790 (9.32%) from 2019.
Note: Historical values (2019–2025) are actual BLS OEWS figures for the Richmond metropolitan area, sourced from annual Occupational Employment and Wage Statistics surveys. 2026–2026 figures are current estimates, and 2027 values are projections, calculated using a 0.98% CAGR derived from 7-year BLS historical data. Actual salaries may vary based on employer, experience, certifications, and local market conditions.
Salary by Experience Level
| Experience | Estimated Salary Range |
|---|---|
| 0-2 years (New Graduate) | $72,435 – $88,787 |
| 3-5 years (Mid Career) | $88,787 – $102,130 |
| 5+ years (Experienced) | $102,130 – $130,603 |
| 10+ years (Top Earner) | $130,603 – $158,301 |
Teacher salary ranges estimated from BLS percentile data. Individual elementary school teacher compensation varies by employer, certifications, and specialization.
Elementary School Teacher Job Market in Richmond
Considering the broader context, Richmond's job market hosts approximately 25 elementary school teachers, indicating a selective hiring process amidst a competitive atmosphere. The cost-of-living index sits at 113.1, suggesting that while salaries are higher than the national average, the purchasing power of those earnings can be diminished due to living expenses. Public school districts tend to offer the most stable salaries, but charter networks, such as KIPP, may provide competitive wages alongside additional stipends for specialized fields like special education or STEM. To maximize earnings in Richmond’s education sector, teachers should consider pursuing National Board Certification or additional educational qualifications, which can further elevate their positioning on the salary scale. Strategies such as taking on summer school contracts or after-school tutoring can also enhance overall compensation, making thoughtful career choices essential for achieving financial stability as an elementary school teacher in this high-cost area.
More salary data for Richmond, CA:
Frequently Asked Questions
How much do elementary school teachers make in Richmond, CA in 2026?
Is Richmond, CA a good place to work as a elementary school teacher?
Can elementary school teachers make $100K in Richmond?
What is the cost-of-living adjusted elementary school teacher salary in Richmond?
How much does a elementary school teacher make per hour in Richmond?
Related Pages
Compare Salaries
Career Resources
Nearby Cities in California
Written by Jordan Lee, M.Ed.
Career Analyst
Jordan Lee has over 10 years of experience in elementary education. They focus on curriculum development and teaching methodologies. Their experience includes working in public schools.
Methodology & Data Source
Salary figures on this page are 2026 projections based on the Bureau of Labor Statistics Occupational Employment and Wage Statistics (OEWS) survey, May 2026 release. The BLS reported a median annual salary of $101,139 for elementary school teachersin the Richmond metropolitan area. A 0.98% compound annual growth rate (CAGR), calculated from 6-year national BLS wage trends, was applied to project current 2026 compensation. Percentile ranges (P10–P90) represent the full salary distribution across experience levels and practice settings in this market.
Data Sources & Methodology
Salary data for Richmond is estimated from official BLS state-level occupational wage data (2025), adjusted for regional cost-of-living differences using BEA RPP (Regional Price Parities).
2026 figures are projected from 2025 BLS data using a compound annual growth rate (CAGR) of 0.98%, derived from historical BLS wage trends for elementary school teachers (SOC 25-2021).
Compiled and verified by Jordan Lee, M.Ed., a licensed elementary school teacher with 10+ years of clinical experience. · View source data at BLS.gov