Elementary School Teacher Salary in Norfolk, NE: $55,047 (2026)
Quick Answer:A full-time elementary school teacher in Norfolk, NE earns a median $55,047/year (≈ $26.47/hour) in nominal terms for 2026 — projected from BLS OEWS 2025 (SOC 25-2021). Once you factor in Norfolk's price level (8% below national, BEA RPP 91.5), that paycheck buys what $60,161 would nationally. Nominal pay sits 6.9% below the Nebraska state average.
Based on BLS state-level estimates · View source
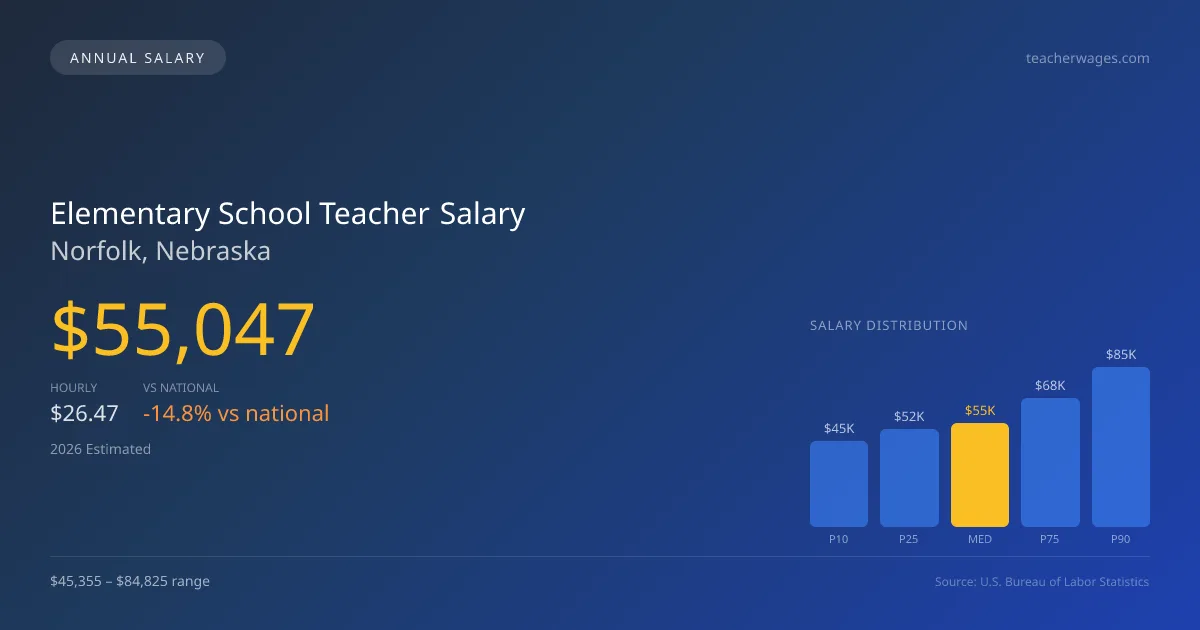
In 2026, Norfolk, Nebraska, projects a median annual salary of $55,047 for elementary school teachers, a figure that falls significantly below the national average of $64,597. Teachers in the Virginia active salary range between $45,355 at the 10th percentile and $84,825 at the 90th percentile, reflecting the differences in experience and educational attainment across the district's step-and-lane pay scale. Those with advanced degrees, such as a master’s or higher, may find themselves positioned favorably on the pay scale, influencing their overall compensation significantly. Given these numbers, it’s clear that prospective educators in Norfolk need to evaluate the local financial landscape as they consider their career options.
About the Norfolk Market
Salary estimated from Nebraska average ($62,000) adjusted for local cost of living.
Salary Breakdown
| Percentile | Annual | Hourly |
|---|---|---|
| Entry Level (P10) | $45,355 | $21.80 |
| Lower Range (P25) | $52,025 | $25.01 |
| Median (P50)(typical) | $55,047 | $26.47 |
| Upper Range (P75) | $68,453 | $32.91 |
| Top Earners (P90) | $84,825 | $40.79 |
Median Salary Position
14.78% below the national average
2026 Salary Percentile Distribution in Norfolk
In Norfolk, NE, the elementary school teacher salary spread from the 10th to 90th percentile is $39,470 (2026 est.). At $55,047, the local median is 14.78% below the national median of $64,597.
Salary Calculator
At 40 hours/week in Norfolk: You'd be in the lower-middle range
How Norfolk Elementary School Teacher Pay Compares
Norfolk median: $55,047/year (2026)
| Compared To | Median Salary | Norfolk Pays |
|---|---|---|
| Nebraska Average | $59,127 | -6.90% less |
| National Average | $64,597 | -14.78% less |
Elementary School Teachers in Norfolk, NE earn a median of $55,047 per year (2026 est.), which is 14.78% lower than the national median of $64,597 and 6.90% below the Nebraska state average of $59,127.
Cost-of-Living Adjusted Salary
Norfolk has a cost of living 8.50% below the national average, meaning your salary goes further here.
Adjusted salary = nominal × (100 / CoL index). CoL index: 100 = national average.
Norfolk, NE has a cost-of-living index of 91.5 (below the national average of 100). A elementary school teacher earning $55,047 nominally has purchasing power equivalent to $60,161 in an average-cost city — an effective 9.29% boost.
Compare Purchasing Power
Select a city to see how your salary compares after cost of living
Select a city above to compare purchasing power
2019 BLS Actual
$50,849
2025 BLS Actual
$54,513
2026 Current Est.
$55,047
2019–2027 Growth
+9.3%
Salary Trajectory for Elementary School Teachers in Norfolk (2019–2027)
2019–2025: actual BLS OEWS data for this metro area. 2026+: CAGR 0.98% projection.
| Year | Annual Salary | Status |
|---|---|---|
| 2019 | $50,849 | Actual |
| 2020 | $51,931 | Actual |
| 2021 | $52,323 | Actual |
| 2022 | $52,570 | Actual |
| 2023 | $54,266 | Actual |
| 2024 | $52,833 | Actual |
| 2025 | $54,513 | Actual |
| 2026(current) | $55,047 | Estimated |
| 2027 | $55,587 | Projected |
Based on 7 years of BLS OEWS data for the Norfolk metropolitan area, the median elementary school teacher salary grew 7.2% from $50,849 (2019) to $54,513 (2025). At a 0.98% compound annual growth rate, salaries are projected to reach $55,587 by 2027 — a total increase of $4,738 (9.32%) from 2019.
Note: Historical values (2019–2025) are actual BLS OEWS figures for the Norfolk metropolitan area, sourced from annual Occupational Employment and Wage Statistics surveys. 2026–2026 figures are current estimates, and 2027 values are projections, calculated using a 0.98% CAGR derived from 7-year BLS historical data. Actual salaries may vary based on employer, experience, certifications, and local market conditions.
Salary by Experience Level
| Experience | Estimated Salary Range |
|---|---|
| 0-2 years (New Graduate) | $45,355 – $52,025 |
| 3-5 years (Mid Career) | $52,025 – $55,047 |
| 5+ years (Experienced) | $55,047 – $68,453 |
| 10+ years (Top Earner) | $68,453 – $84,825 |
Teacher salary ranges estimated from BLS percentile data. Individual elementary school teacher compensation varies by employer, certifications, and specialization.
Elementary School Teacher Job Market in Norfolk
With only six elementary school teachers currently employed in Norfolk, the job market is relatively stable but limited, allowing for a closer examination of compensation dynamics. The local cost of living index stands at 91.5, suggesting that while salaries may be lower than the national average, the purchasing power in Norfolk is more favorable than in higher-cost areas. Among employers, K-12 public school districts typically provide the best salary offers, particularly for those specialized in shortage areas like special education or STEM, which can come with substantial stipends. To maximize their earnings, teachers can pursue opportunities for summer school contracts, after-school tutoring, and advanced certifications such as the National Board Certification. Engaging in these options could bridge the salary gap and enhance their pay profile within the Norfolk education system.
More salary data for Norfolk, NE:
Frequently Asked Questions
How much do elementary school teachers make in Norfolk, NE in 2026?
Is Norfolk, NE a good place to work as a elementary school teacher?
Can elementary school teachers make $100K in Norfolk?
What is the cost-of-living adjusted elementary school teacher salary in Norfolk?
How much does a elementary school teacher make per hour in Norfolk?
Related Pages
Compare Salaries
Career Resources
Nearby Cities in Nebraska
Written by Jordan Lee, M.Ed.
Career Analyst
Jordan Lee has over 10 years of experience in elementary education. They focus on curriculum development and teaching methodologies. Their experience includes working in public schools.
Methodology & Data Source
Salary figures on this page are 2026 projections based on the Bureau of Labor Statistics Occupational Employment and Wage Statistics (OEWS) survey, May 2026 release. The BLS reported a median annual salary of $54,513 for elementary school teachersin the Norfolk metropolitan area. A 0.98% compound annual growth rate (CAGR), calculated from 6-year national BLS wage trends, was applied to project current 2026 compensation. Percentile ranges (P10–P90) represent the full salary distribution across experience levels and practice settings in this market.
Data Sources & Methodology
Salary data for Norfolk is estimated from official BLS state-level occupational wage data (2025), adjusted for regional cost-of-living differences using BEA RPP (Regional Price Parities).
2026 figures are projected from 2025 BLS data using a compound annual growth rate (CAGR) of 0.98%, derived from historical BLS wage trends for elementary school teachers (SOC 25-2021).
Compiled and verified by Jordan Lee, M.Ed., a licensed elementary school teacher with 10+ years of clinical experience. · View source data at BLS.gov