Elementary School Teacher Salary in Oregon: $78,765 (2026)
Quick Answer:Across Oregon's 36 metropolitan areas, the average median elementary school teacher pay sits at $78,765/year heading into 2026 — a figure projected from 2025 BLS OEWS wage data for SOC 25-2021. Because Oregon sits at BEA RPP 102.6 (3% above the U.S. baseline), that statewide median translates to roughly $76,769 in nationally-comparable purchasing power. Highest-paying metros: Hillsboro ($84,204), Portland ($82,330), Bend ($77,810).
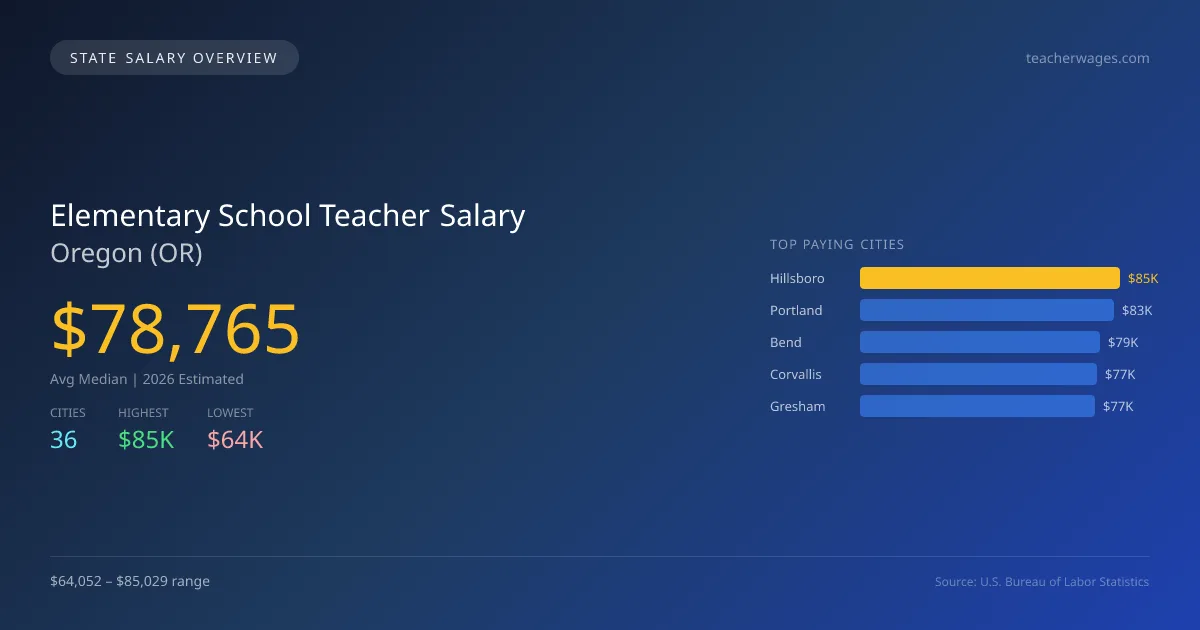
In 2026, elementary school teachers in Oregon are projected to earn an average median salary of $78,765, which is significantly higher than the national median of $64,597, reflecting a difference of 21.9%. Salary variation among cities is notable, with the highest-paying city being Hillsboro at $85,029, while Springfield has the lowest at $64,052. This $20,977 gap can be attributed to factors such as the cost of living, school district funding, and local demand for teachers. Oregon's state licensing requirements necessitate a bachelor's degree in education and completion of a teacher preparation program, which can influence salary levels. Additionally, the demand for qualified elementary teachers is driven by state population trends and educational policies. With a total of 12,344 employed elementary school teachers, the job market shows a steady growth rate of 0.98% annually, indicating ongoing opportunities in the field. Other top-paying cities include Portland at $83,137, Bend at $78,573, Corvallis at $77,462, and Gresham at $77,012. For aspiring educators, Oregon presents a favorable landscape regarding salary potential and employment opportunities in the elementary education sector.
Oregon Elementary School Teacher Salary Range
Overall salary range in Oregon: $47,259 (lowest entry-level) to $131,795 (highest top earner)
Oregon vs National Average
Oregon elementary school teachers earn 21.93% more than the national median (+$14,168/year difference).
Oregon Elementary School Teacher Salary Distribution (2026)
Elementary School Teacher salaries in Oregon range from $50,011 (entry-level, 10th percentile) to $103,851 (top earners, 90th percentile), with a median of $78,765. The Oregon median is $14,168 above the US national median of $64,597. The average hourly rate is $37.87/hr. Approximately 12,344 elementary school teachers are employed across 36 cities.
2019 BLS Actual
$71,292
2025 BLS Actual
$78,001
2026 Current Est.
$78,765
2019–2027 Growth
+11.6%
Salary Trajectory for Elementary School Teachers in Oregon (2019–2027)
2019–2025: actual BLS OEWS data for this metro area. 2026+: CAGR 0.98% projection.
| Year | Annual Salary | Status |
|---|---|---|
| 2019 | $71,292 | Actual |
| 2020 | $74,539 | Actual |
| 2021 | $76,578 | Actual |
| 2022 | $79,909 | Actual |
| 2023 | $87,247 | Actual |
| 2024 | $73,903 | Actual |
| 2025 | $78,001 | Actual |
| 2026(current) | $78,765 | Estimated |
| 2027 | $79,537 | Projected |
Based on 7 years of BLS OEWS data for the Oregon metropolitan area, the median elementary school teacher salary grew 9.4% from $71,292 (2019) to $78,001 (2025). At a 0.98% compound annual growth rate, salaries are projected to reach $79,537 by 2027 — a total increase of $8,245 (11.57%) from 2019.
Note: Historical values (2019–2025) are actual BLS OEWS figures for the Oregon metropolitan area, sourced from annual Occupational Employment and Wage Statistics surveys. 2026–2026 figures are current estimates, and 2027 values are projections, calculated using a 0.98% CAGR derived from 7-year BLS historical data. Actual salaries may vary based on employer, experience, certifications, and local market conditions.
Top 5 Highest Paying Cities in Oregon
Lowest Paying Cities in Oregon
| City | Median Salary |
|---|---|
| Springfield | $64,052 |
| Eugene | $64,890 |
| Medford | $66,475 |
| Milwaukie | $69,173 |
| Klamath Falls | $69,337 |
Best Value Cities for Elementary School Teachers in Oregon
When adjusted for local cost of living, these Oregon cities offer the most purchasing power for elementary school teachers.
| City | Nominal Salary | CoL Index | Adjusted Salary |
|---|---|---|---|
| Hillsboro | $85,029 | 102.6 | $82,874 |
| Portland | $83,137 | 105.421 | $78,862 |
| Grants Pass | $74,988 | 97.76 | $76,706 |
| Bend | $78,573 | 103.607 | $75,838 |
| Gresham | $77,012 | 102.6 | $75,060 |
Adjusted salary = nominal salary × (100 / CoL index). CoL index: 100 = national average. Lower index = lower cost of living.
Salary by Experience Level in Oregon
| Experience Level | Estimated Annual |
|---|---|
| Entry Level (0-2 years) | $50,011 |
| Mid Career (3-7 years) | $78,765 |
| Experienced (7+ years) | $103,851 |
Estimates based on BLS percentile data averaged across Oregon metro areas. Individual pay varies by employer, certifications, and specialization.
All 36 Cities in Oregon
| # | City | Median Salary |
|---|---|---|
| 1 | Hillsboro | $85,029 |
| 2 | Portland | $83,137 |
| 3 | Bend | $78,573 |
| 4 | Corvallis | $77,462 |
| 5 | Gresham | $77,012 |
| 6 | Salem | $75,543 |
| 7 | Grants Pass | $74,988 |
| 8 | Beaverton | $74,820 |
| 9 | McMinnville | $74,616 |
| 10 | Oregon City | $74,529 |
| 11 | Woodburn | $74,032 |
| 12 | Lake Oswego | $73,676 |
| 13 | Albany | $73,675 |
| 14 | Forest Grove | $73,483 |
| 15 | Tigard | $73,174 |
| 16 | Redmond | $73,151 |
| 17 | West Linn | $72,940 |
| 18 | Tualatin | $72,310 |
| 19 | Pendleton | $72,303 |
| 20 | Wilsonville | $72,199 |
| 21 | Happy Valley | $71,579 |
| 22 | Hermiston | $71,381 |
| 23 | Central Point | $71,346 |
| 24 | Ashland | $71,341 |
| 25 | Keizer | $71,322 |
| 26 | Sherwood | $71,318 |
| 27 | Coos Bay | $71,200 |
| 28 | Roseburg | $70,939 |
| 29 | Canby | $70,899 |
| 30 | Newberg | $70,509 |
| 31 | The Dalles | $69,756 |
| 32 | Klamath Falls | $69,337 |
| 33 | Milwaukie | $69,173 |
| 34 | Medford | $66,475 |
| 35 | Eugene | $64,890 |
| 36 | Springfield | $64,052 |
More Oregon Salary Data
Hourly Rates
Explore elementary school teacher hourly pay in Oregon cities.
Senior / Experienced
Top earner salaries for experienced elementary school teachers.
Explore More Elementary School Teacher Salary Data
Frequently Asked Questions
How much do elementary school teachers make in Oregon in 2026?
What is the highest paying city for elementary school teachers in Oregon?
How does Oregon elementary school teacher pay compare to the national average?
What is the entry-level elementary school teacher salary in Oregon?
How many elementary school teachers are employed in Oregon?
Which Oregon city offers the best value for elementary school teachers?
Written by Jordan Lee, M.Ed.
Career Analyst
Jordan Lee has over 10 years of experience in elementary education. They focus on curriculum development and teaching methodologies. Their experience includes working in public schools.
Methodology & Data Source
Statewide salary figures on this page are 2026 projections based on the Bureau of Labor Statistics Occupational Employment and Wage Statistics (OEWS) survey, May 2026 release. A 0.98% compound annual growth rate (CAGR), derived from 6-year national BLS wage trends, was applied to each metro area's reported salary to estimate current 2026 elementary school teacher compensation across Oregon. State averages are employment-weighted across 36 metro areas — larger metro areas with more elementary school teacherscontribute proportionally more to the average, producing figures that better reflect typical compensation. Individual pay varies by city, employer, certifications, and experience.
Data Sources & Methodology
Source: BLS, OEWS, 7-year dataset (–). Per-city data from annual BLS metropolitan area surveys.
2026 figures are projected from 2025 BLS data using a compound annual growth rate (CAGR) of 0.98%, derived from historical BLS wage trends for elementary school teachers (SOC 25-2021).
Compiled and verified by Jordan Lee, M.Ed., a licensed elementary school teacher with 10+ years of clinical experience. · View source data at BLS.gov