Elementary School Teacher Salary in Vermont: $77,332 (2026)
Quick Answer:Across Vermont's 9 metropolitan areas, the average median elementary school teacher pay sits at $77,332/year heading into 2026 — a figure projected from 2025 BLS OEWS wage data for SOC 25-2021. Because Vermont sits at BEA RPP 103.5 (4% above the U.S. baseline), that statewide median translates to roughly $74,717 in nationally-comparable purchasing power. Highest-paying metros: South Burlington ($77,421), Burlington ($77,030), Bennington ($63,444).
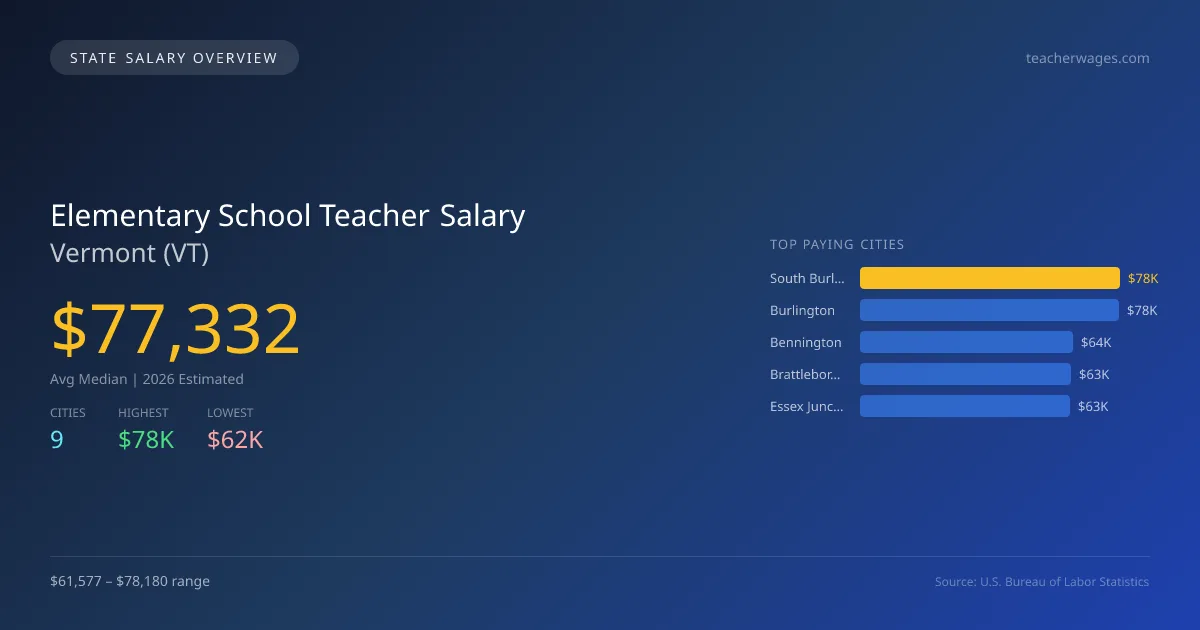
In Vermont, the projected average median salary for elementary school teachers in 2026 is $77,331, which is significantly higher than the national median of $64,597, representing a 19.7% increase. The highest paying city within the state is South Burlington, where teachers are projected to earn $78,180, while Montpelier offers the lowest salaries at $61,577. The salary gap of $16,603 between these cities can be attributed to factors such as cost of living, local school funding, and demand for teachers in specific regions. Vermont has specific licensing requirements that teachers must meet, including a bachelor's degree and completion of an educator preparation program. The state's scope of practice laws also influence the market, as they determine the level of qualifications needed. The demand for elementary school teachers is generally stable, with a projected annual compound growth rate of 0.98%. As of now, there are approximately 1,180 elementary school teachers employed across Vermont. The top cities projected in 2026 for salaries are South Burlington at $78,180, Burlington at $77,785, followed by Bennington at $64,066, Brattleboro at $63,342, and Essex Junction at $63,205. Overall, the job market for teachers in Vermont appears to maintain a steady outlook.
Vermont Elementary School Teacher Salary Range
Overall salary range in Vermont: $48,371 (lowest entry-level) to $121,179 (highest top earner)
Vermont vs National Average
Vermont elementary school teachers earn 19.71% more than the national median (+$12,735/year difference).
Vermont Elementary School Teacher Salary Distribution (2026)
Elementary School Teacher salaries in Vermont range from $50,414 (entry-level, 10th percentile) to $102,763 (top earners, 90th percentile), with a median of $77,332. The Vermont median is $12,735 above the US national median of $64,597. The average hourly rate is $37.18/hr. Approximately 1,180 elementary school teachers are employed across 9 cities.
2019 BLS Actual
$60,150
2025 BLS Actual
$76,581
2026 Current Est.
$77,332
2019–2027 Growth
+29.8%
Salary Trajectory for Elementary School Teachers in Vermont (2019–2027)
2019–2025: actual BLS OEWS data for this metro area. 2026+: CAGR 0.98% projection.
| Year | Annual Salary | Status |
|---|---|---|
| 2019 | $60,150 | Actual |
| 2020 | $62,570 | Actual |
| 2021 | $61,490 | Actual |
| 2022 | $62,490 | Actual |
| 2023 | $66,720 | Actual |
| 2024 | $64,481 | Actual |
| 2025 | $76,581 | Actual |
| 2026(current) | $77,332 | Estimated |
| 2027 | $78,090 | Projected |
Based on 7 years of BLS OEWS data for the Vermont metropolitan area, the median elementary school teacher salary grew 27.3% from $60,150 (2019) to $76,581 (2025). At a 0.98% compound annual growth rate, salaries are projected to reach $78,090 by 2027 — a total increase of $17,940 (29.83%) from 2019.
Note: Historical values (2019–2025) are actual BLS OEWS figures for the Vermont metropolitan area, sourced from annual Occupational Employment and Wage Statistics surveys. 2026–2026 figures are current estimates, and 2027 values are projections, calculated using a 0.98% CAGR derived from 7-year BLS historical data. Actual salaries may vary based on employer, experience, certifications, and local market conditions.
Top 5 Highest Paying Cities in Vermont
Lowest Paying Cities in Vermont
| City | Median Salary |
|---|---|
| Montpelier | $61,577 |
| Colchester | $61,889 |
| Rutland | $61,959 |
| Barre | $63,121 |
| Essex Junction | $63,205 |
Best Value Cities for Elementary School Teachers in Vermont
When adjusted for local cost of living, these Vermont cities offer the most purchasing power for elementary school teachers.
| City | Nominal Salary | CoL Index | Adjusted Salary |
|---|---|---|---|
| Burlington | $77,785 | 100.949 | $77,054 |
| South Burlington | $78,180 | 103.5 | $75,536 |
| Bennington | $64,066 | 103.5 | $61,900 |
| Brattleboro | $63,342 | 103.5 | $61,200 |
| Essex Junction | $63,205 | 103.5 | $61,068 |
Adjusted salary = nominal salary × (100 / CoL index). CoL index: 100 = national average. Lower index = lower cost of living.
Salary by Experience Level in Vermont
| Experience Level | Estimated Annual |
|---|---|
| Entry Level (0-2 years) | $50,414 |
| Mid Career (3-7 years) | $77,332 |
| Experienced (7+ years) | $102,763 |
Estimates based on BLS percentile data averaged across Vermont metro areas. Individual pay varies by employer, certifications, and specialization.
All 9 Cities in Vermont
| # | City | Median Salary |
|---|---|---|
| 1 | South Burlington | $78,180 |
| 2 | Burlington | $77,785 |
| 3 | Bennington | $64,066 |
| 4 | Brattleboro | $63,342 |
| 5 | Essex Junction | $63,205 |
| 6 | Barre | $63,121 |
| 7 | Rutland | $61,959 |
| 8 | Colchester | $61,889 |
| 9 | Montpelier | $61,577 |
More Vermont Salary Data
Hourly Rates
Explore elementary school teacher hourly pay in Vermont cities.
Entry Level
Starting salaries for new elementary school teachers.
Senior / Experienced
Top earner salaries for experienced elementary school teachers.
Explore More Elementary School Teacher Salary Data
Frequently Asked Questions
How much do elementary school teachers make in Vermont in 2026?
What is the highest paying city for elementary school teachers in Vermont?
How does Vermont elementary school teacher pay compare to the national average?
What is the entry-level elementary school teacher salary in Vermont?
How many elementary school teachers are employed in Vermont?
Which Vermont city offers the best value for elementary school teachers?
Written by Jordan Lee, M.Ed.
Career Analyst
Jordan Lee has over 10 years of experience in elementary education. They focus on curriculum development and teaching methodologies. Their experience includes working in public schools.
Methodology & Data Source
Statewide salary figures on this page are 2026 projections based on the Bureau of Labor Statistics Occupational Employment and Wage Statistics (OEWS) survey, May 2026 release. A 0.98% compound annual growth rate (CAGR), derived from 6-year national BLS wage trends, was applied to each metro area's reported salary to estimate current 2026 elementary school teacher compensation across Vermont. State averages are employment-weighted across 9 metro areas — larger metro areas with more elementary school teacherscontribute proportionally more to the average, producing figures that better reflect typical compensation. Individual pay varies by city, employer, certifications, and experience.
Data Sources & Methodology
Source: BLS, OEWS, 7-year dataset (–). Per-city data from annual BLS metropolitan area surveys.
2026 figures are projected from 2025 BLS data using a compound annual growth rate (CAGR) of 0.98%, derived from historical BLS wage trends for elementary school teachers (SOC 25-2021).
Compiled and verified by Jordan Lee, M.Ed., a licensed elementary school teacher with 10+ years of clinical experience. · View source data at BLS.gov