Elementary School Teacher Salary in Virginia: $62,622 (2026)
Quick Answer:Across Virginia's 42 metropolitan areas, the average median elementary school teacher pay sits at $62,622/year heading into 2026 — a figure projected from 2025 BLS OEWS wage data for SOC 25-2021. Because Virginia sits at BEA RPP 103.2 (3% above the U.S. baseline), that statewide median translates to roughly $60,680 in nationally-comparable purchasing power. Highest-paying metros: Alexandria ($78,799), Harrisonburg ($77,340), Norfolk ($64,326).
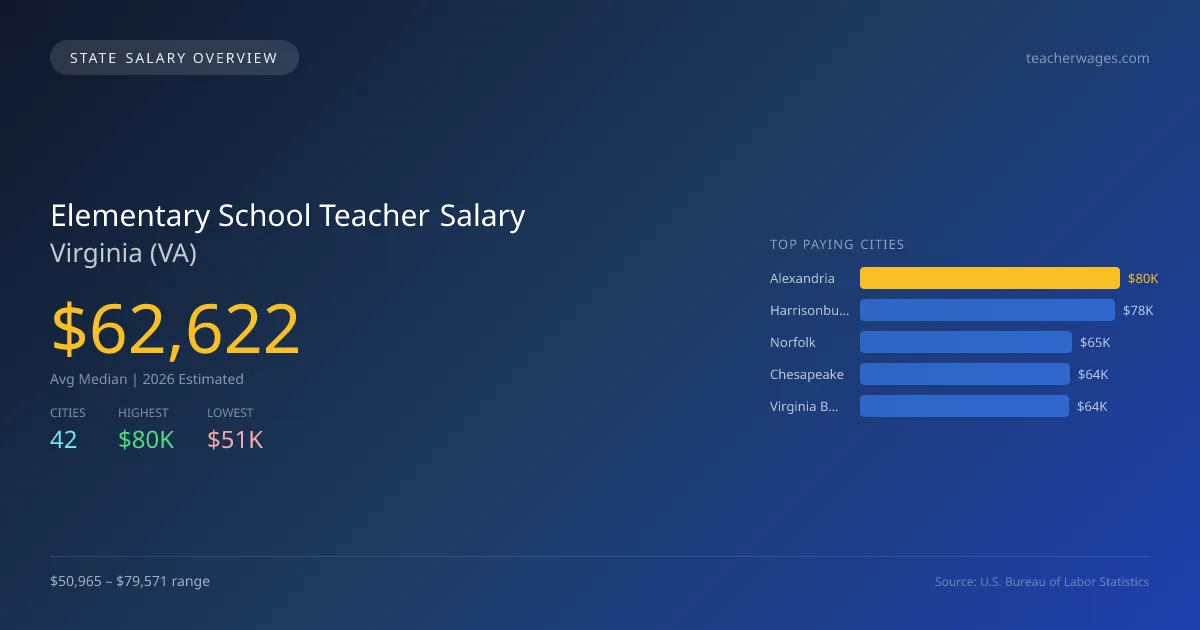
In Virginia, the average median salary for elementary school teachers in 2026 is projected to be $62,622, slightly below the national median of $64,597, indicating a difference of 3.1%. The salary range across different cities varies significantly, with Alexandria leading at $79,571, while Lynchburg offers the lowest at $50,965. This variation can be attributed to factors such as local cost of living, funding for education, and the presence of higher concentrations of educational resources in larger urban areas. Virginia requires teachers to meet specific licensing standards, which include holding a bachelor's degree and obtaining a teaching license through the state board of education. Demand for elementary teachers is driven by population growth in metropolitan areas, prompting a projected annual growth rate of 0.98% for the profession. The top cities projected for 2026 salaries are Alexandria at $79,571, Harrisonburg at $78,098, Norfolk at $64,956, Chesapeake at $64,250, and Virginia Beach at $64,001. Understanding these factors is crucial for those entering or advancing in the teaching profession within Virginia, as salary potential and job market outlook can vary significantly based on location and local demands.
Virginia Elementary School Teacher Salary Range
Overall salary range in Virginia: $43,961 (lowest entry-level) to $123,335 (highest top earner)
Virginia vs National Average
Virginia elementary school teachers earn 3.06% less than the national median ($-1,975/year difference).
Virginia Elementary School Teacher Salary Distribution (2026)
Elementary School Teacher salaries in Virginia range from $50,098 (entry-level, 10th percentile) to $89,082 (top earners, 90th percentile), with a median of $62,622. The Virginia median is $1,975 below the US national median of $64,597. The average hourly rate is $30.11/hr. Approximately 19,010 elementary school teachers are employed across 42 cities.
2019 BLS Actual
$61,911
2025 BLS Actual
$62,014
2026 Current Est.
$62,622
2019–2027 Growth
+2.1%
Salary Trajectory for Elementary School Teachers in Virginia (2019–2027)
2019–2025: actual BLS OEWS data for this metro area. 2026+: CAGR 0.98% projection.
| Year | Annual Salary | Status |
|---|---|---|
| 2019 | $61,911 | Actual |
| 2020 | $61,771 | Actual |
| 2021 | $57,627 | Actual |
| 2022 | $54,831 | Actual |
| 2023 | $58,509 | Actual |
| 2024 | $60,070 | Actual |
| 2025 | $62,014 | Actual |
| 2026(current) | $62,622 | Estimated |
| 2027 | $63,236 | Projected |
Based on 7 years of BLS OEWS data for the Virginia metropolitan area, the median elementary school teacher salary grew 0.2% from $61,911 (2019) to $62,014 (2025). At a 0.98% compound annual growth rate, salaries are projected to reach $63,236 by 2027 — a total increase of $1,325 (2.14%) from 2019.
Note: Historical values (2019–2025) are actual BLS OEWS figures for the Virginia metropolitan area, sourced from annual Occupational Employment and Wage Statistics surveys. 2026–2026 figures are current estimates, and 2027 values are projections, calculated using a 0.98% CAGR derived from 7-year BLS historical data. Actual salaries may vary based on employer, experience, certifications, and local market conditions.
Top 5 Highest Paying Cities in Virginia
Lowest Paying Cities in Virginia
| City | Median Salary |
|---|---|
| Lynchburg | $50,965 |
| Falls Church | $56,983 |
| Herndon | $57,890 |
| Williamsburg | $58,522 |
| Annandale | $58,634 |
Best Value Cities for Elementary School Teachers in Virginia
When adjusted for local cost of living, these Virginia cities offer the most purchasing power for elementary school teachers.
| City | Nominal Salary | CoL Index | Adjusted Salary |
|---|---|---|---|
| Harrisonburg | $78,098 | 94.892 | $82,302 |
| Alexandria | $79,571 | 103.2 | $77,104 |
| Staunton | $61,275 | 91.128 | $67,241 |
| Roanoke | $62,618 | 93.618 | $66,887 |
| Blacksburg | $61,194 | 92.71 | $66,006 |
Adjusted salary = nominal salary × (100 / CoL index). CoL index: 100 = national average. Lower index = lower cost of living.
Salary by Experience Level in Virginia
| Experience Level | Estimated Annual |
|---|---|
| Entry Level (0-2 years) | $50,098 |
| Mid Career (3-7 years) | $62,622 |
| Experienced (7+ years) | $89,082 |
Estimates based on BLS percentile data averaged across Virginia metro areas. Individual pay varies by employer, certifications, and specialization.
All 42 Cities in Virginia
| # | City | Median Salary |
|---|---|---|
| 1 | Alexandria | $79,571 |
| 2 | Harrisonburg | $78,098 |
| 3 | Norfolk | $64,956 |
| 4 | Chesapeake | $64,250 |
| 5 | Virginia Beach | $64,001 |
| 6 | Roanoke | $62,618 |
| 7 | Newport News | $62,280 |
| 8 | Radford | $62,263 |
| 9 | Richmond | $61,891 |
| 10 | Winchester | $61,800 |
| 11 | Hampton | $61,731 |
| 12 | Centreville | $61,443 |
| 13 | Charlottesville | $61,366 |
| 14 | Staunton | $61,275 |
| 15 | Blacksburg | $61,194 |
| 16 | Burke | $61,027 |
| 17 | Suffolk | $60,764 |
| 18 | Tuckahoe | $60,591 |
| 19 | Ashburn | $60,504 |
| 20 | McLean | $60,500 |
| 21 | Reston | $60,436 |
| 22 | Danville | $60,423 |
| 23 | Fredericksburg | $60,164 |
| 24 | Dale City | $60,152 |
| 25 | Manassas | $60,087 |
| 26 | Bristol | $60,050 |
| 27 | Salem | $59,920 |
| 28 | Leesburg | $59,834 |
| 29 | Portsmouth | $59,799 |
| 30 | Mechanicsville | $59,703 |
| 31 | Springfield | $59,492 |
| 32 | Woodbridge | $59,411 |
| 33 | Sterling | $59,295 |
| 34 | Lake Ridge | $59,220 |
| 35 | Linton Hall | $59,152 |
| 36 | Fairfax | $59,001 |
| 37 | Waynesboro | $58,712 |
| 38 | Annandale | $58,634 |
| 39 | Williamsburg | $58,522 |
| 40 | Herndon | $57,890 |
| 41 | Falls Church | $56,983 |
| 42 | Lynchburg | $50,965 |
More Virginia Salary Data
Hourly Rates
Explore elementary school teacher hourly pay in Virginia cities.
Senior / Experienced
Top earner salaries for experienced elementary school teachers.
Explore More Elementary School Teacher Salary Data
Frequently Asked Questions
How much do elementary school teachers make in Virginia in 2026?
What is the highest paying city for elementary school teachers in Virginia?
How does Virginia elementary school teacher pay compare to the national average?
What is the entry-level elementary school teacher salary in Virginia?
How many elementary school teachers are employed in Virginia?
Which Virginia city offers the best value for elementary school teachers?
Written by Jordan Lee, M.Ed.
Career Analyst
Jordan Lee has over 10 years of experience in elementary education. They focus on curriculum development and teaching methodologies. Their experience includes working in public schools.
Methodology & Data Source
Statewide salary figures on this page are 2026 projections based on the Bureau of Labor Statistics Occupational Employment and Wage Statistics (OEWS) survey, May 2026 release. A 0.98% compound annual growth rate (CAGR), derived from 6-year national BLS wage trends, was applied to each metro area's reported salary to estimate current 2026 elementary school teacher compensation across Virginia. State averages are employment-weighted across 42 metro areas — larger metro areas with more elementary school teacherscontribute proportionally more to the average, producing figures that better reflect typical compensation. Individual pay varies by city, employer, certifications, and experience.
Data Sources & Methodology
Source: BLS, OEWS, 7-year dataset (–). Per-city data from annual BLS metropolitan area surveys.
2026 figures are projected from 2025 BLS data using a compound annual growth rate (CAGR) of 0.98%, derived from historical BLS wage trends for elementary school teachers (SOC 25-2021).
Compiled and verified by Jordan Lee, M.Ed., a licensed elementary school teacher with 10+ years of clinical experience. · View source data at BLS.gov